Paul Stergiou, Consolidated Edison, New York
“Recent addition of advanced fault location capability has significantly increased the value of these systems, reducing the time required to locate feeder faults at Con Edison by more than one hour.”

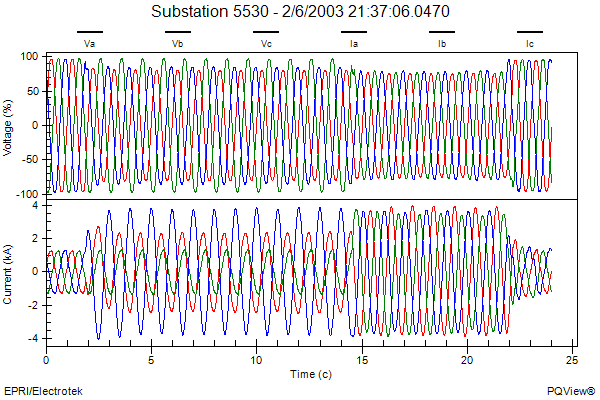
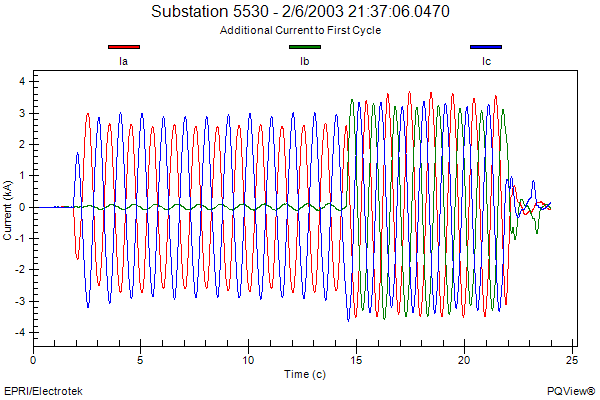
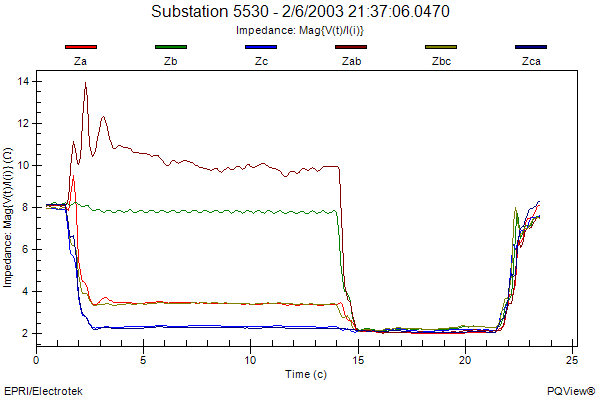
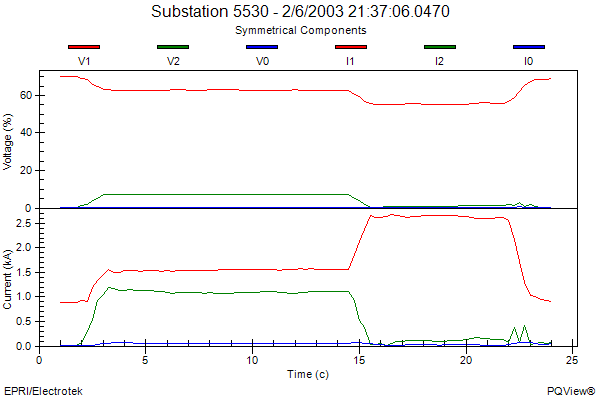
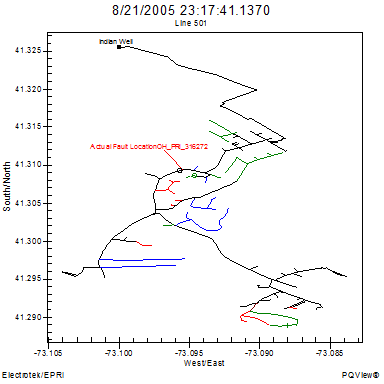
Fault analysis and location functionality in PQView is enabled via the FaultPoint® Add-In Module. FaultPoint combines three functions: fault identification from waveform samples, estimation of impedance-to-fault from the waveforms, and display of the estimated fault location using interactive one-line diagrams and maps.
The following list is a summary of the functionality supported by FaultPoint:
Identifies Single-Phase Faults from Waveform Samples Recorded by Meters with the following configurations:
- three-phase line-neutral voltage with three-phase line currents
- three-phase line-line voltage with zero-sequence source impedance and three-phase line currents
- three-phase line-neutral voltage with zero-sequence source impedance and no line currents
Identifies Multi-Phase Faults from Waveform Samples Recorded by Meters with the following configurations:
- three-phase line-neutral voltage with three-phase line currents
- three-phase line-line voltage and three-phase line currents
Identifies Start and End of Faults from Waveform Samples
Identifies Sub-cycle Faults from Waveform Samples
Identifies Magnetizing Transformer Inrush Current from Waveform Samples
Estimates Fault Location for Single-Phase Faults using One of Four Methods:
- Reactance-to-Fault Method
- Loop Reactance
- Loop Impedance
- Absolute Impedance
Sends email notification for Fault Events via an SMTP Server
- Email notification includes OSIsoft PI System event correlation if available
- Email notification includes Digital Status Summary if Data Source is Digital Relay
Correlates Fault Events with SCADA Operation Events
Builds Fault Event Lists in PQView and WebPQView
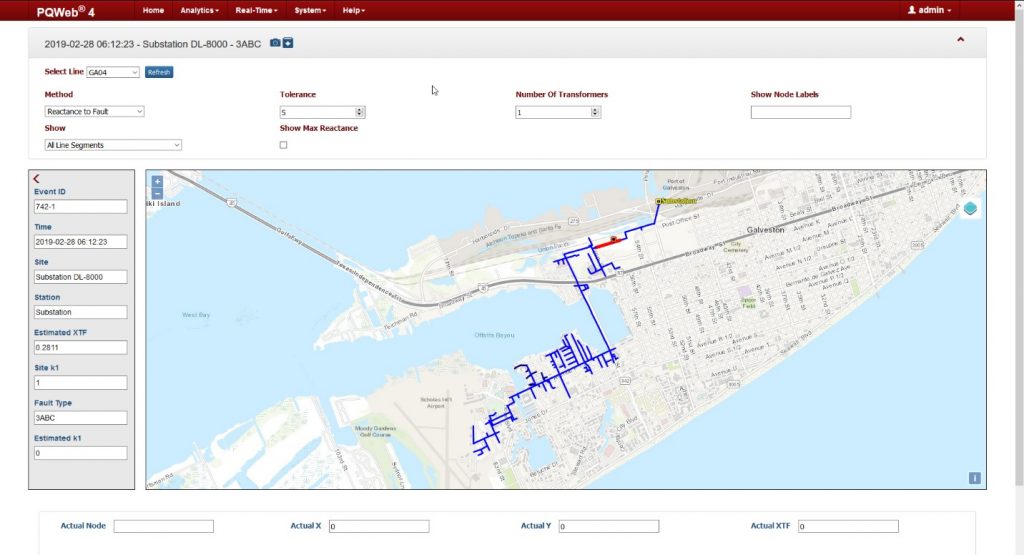
Displays Estimated Fault Location on One-Line Diagram in PQView and WebPQView
Export of One-Line Diagram to KML Viewer such as Google Earth.
Creates Fault Analysis Charts and Summaries
Analyzes Faults using a Follow-On Fault Processing Module
Imports Geographic and Electrical Data for Distribution Lines from Eaton/Cooper CYMDIST Databases or Synergi Electric databases.
Imports and/or Derives Positive-Sequence and Zero-Sequence Impedance from CYMDIST/SynerGEE Databases
Converts Coordinates from Custom Projection System to Coordinates Compatible with Third-Party GIS Applications such as Google Earth.