PQView 4 offers you the latest static, interactive, and derived charts for your Power Quality monitoring system.

Static Charts

Interactive Charts

Derived Charts

Our state-of-the-art charts are available for the following categories:

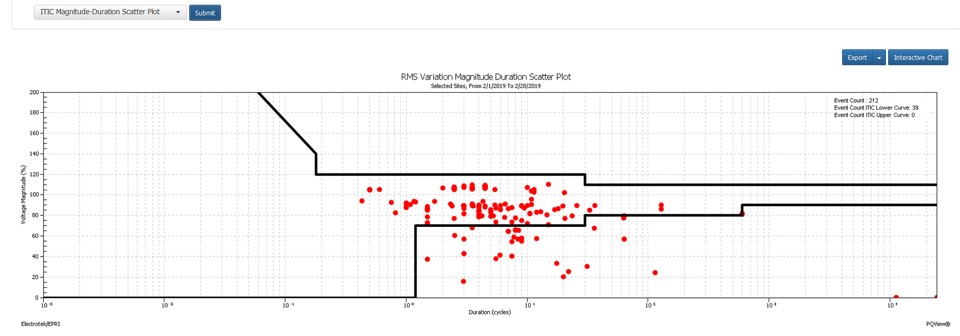
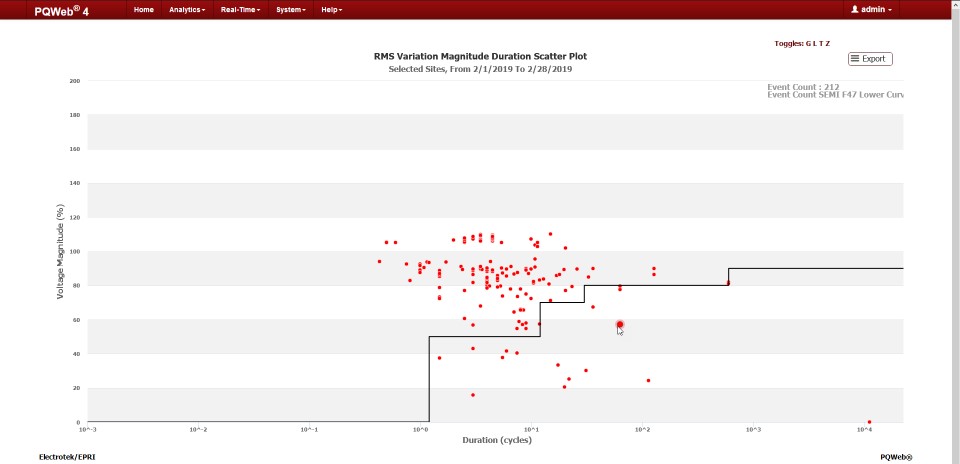
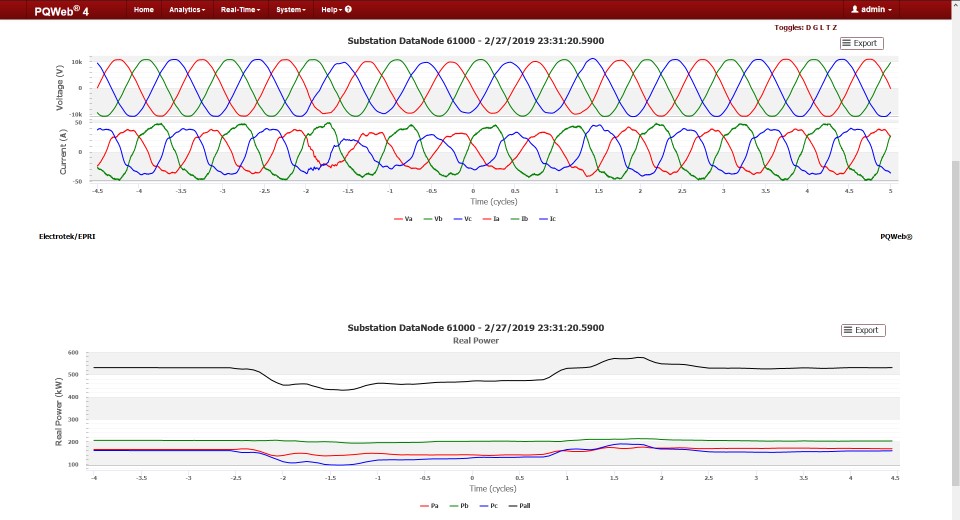
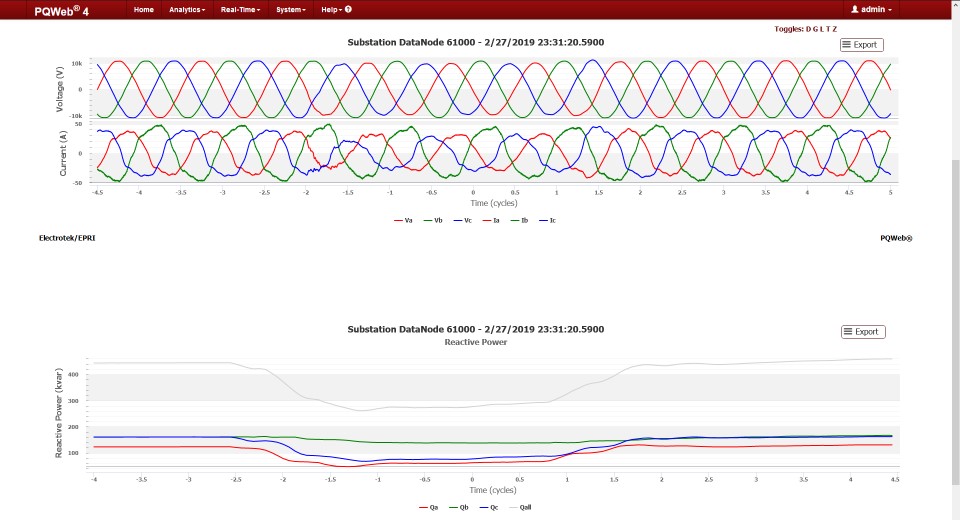
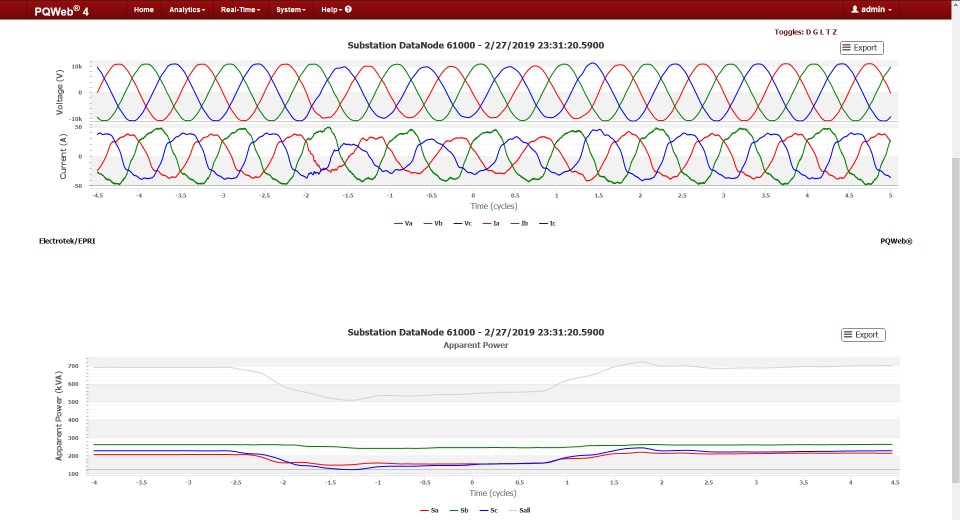
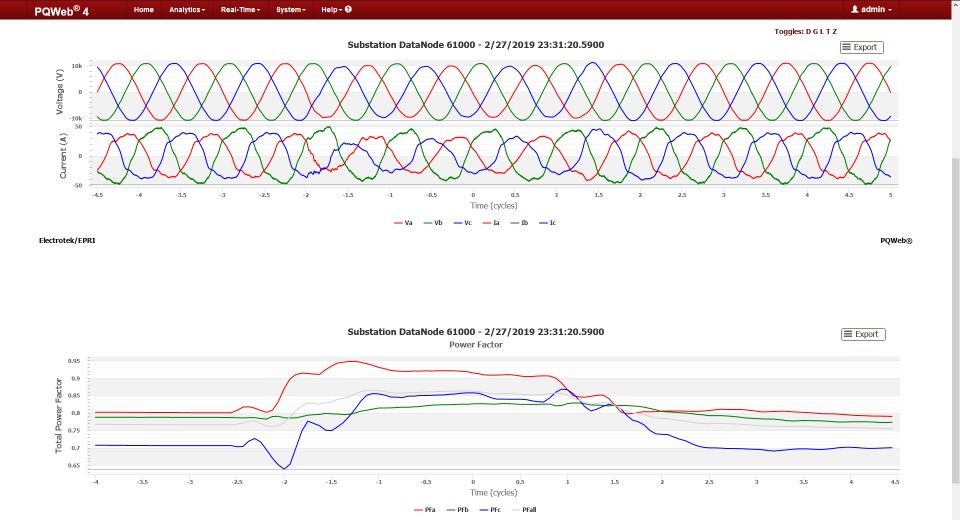
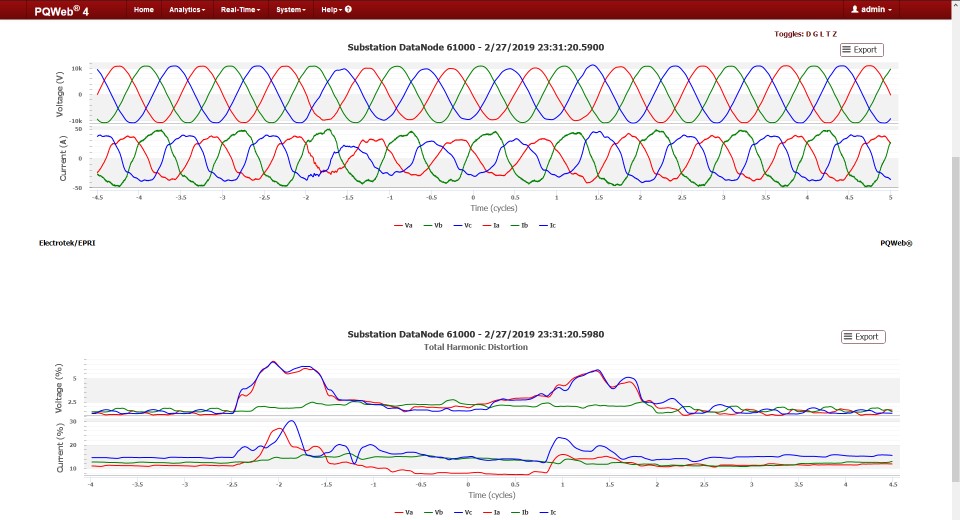
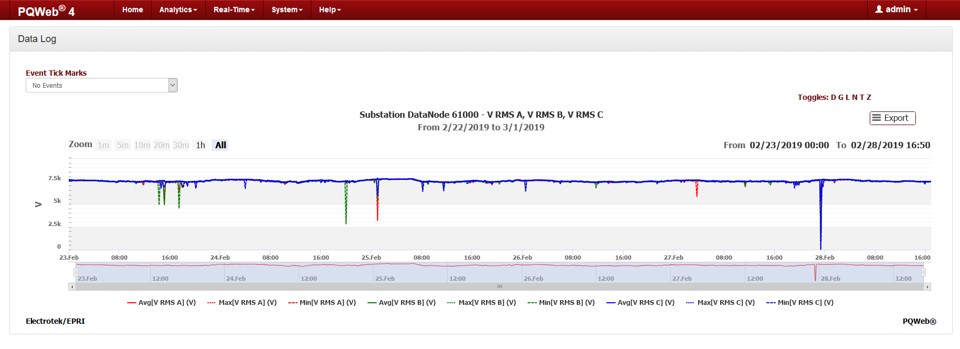
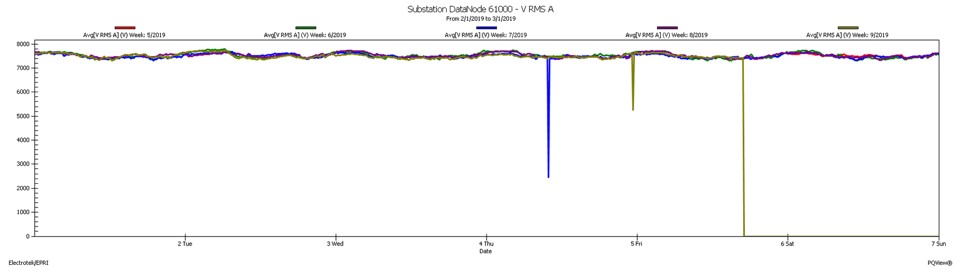
Voltage/Current Waveform Analysis

Charts showing some of PQView’s analysis functions available from power systems monitors that record voltage and/or current samples.

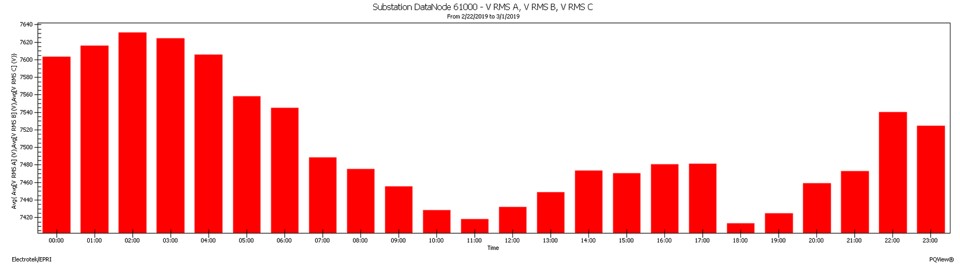
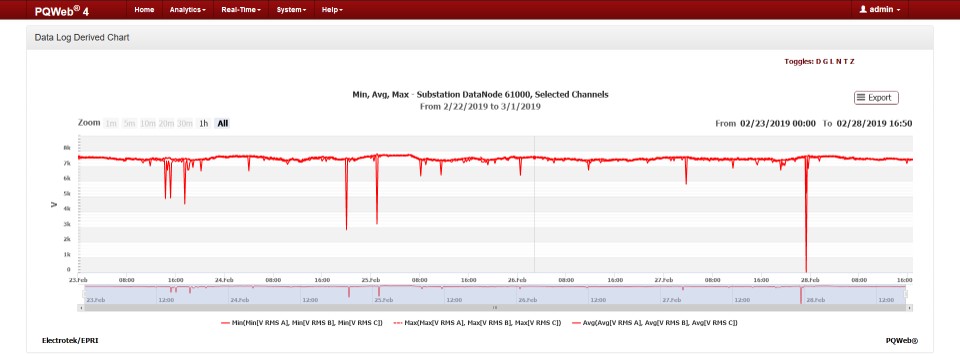
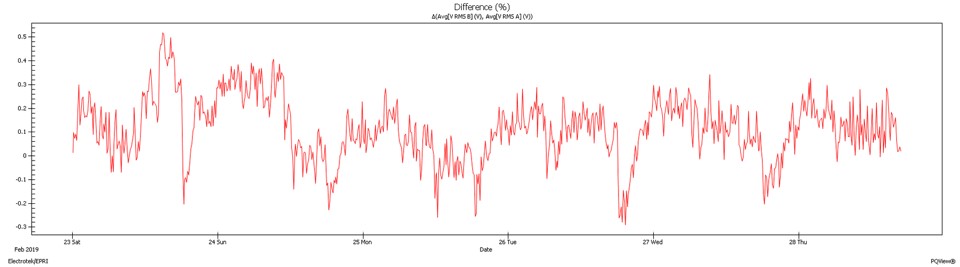
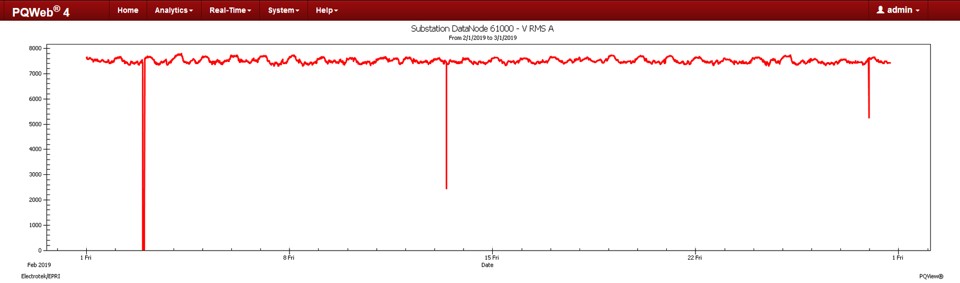
PQView offers Voltage and Current Analysis via Derived Charts.

All charts can be download it to JPEG, PDF and other known formats for your convenience.

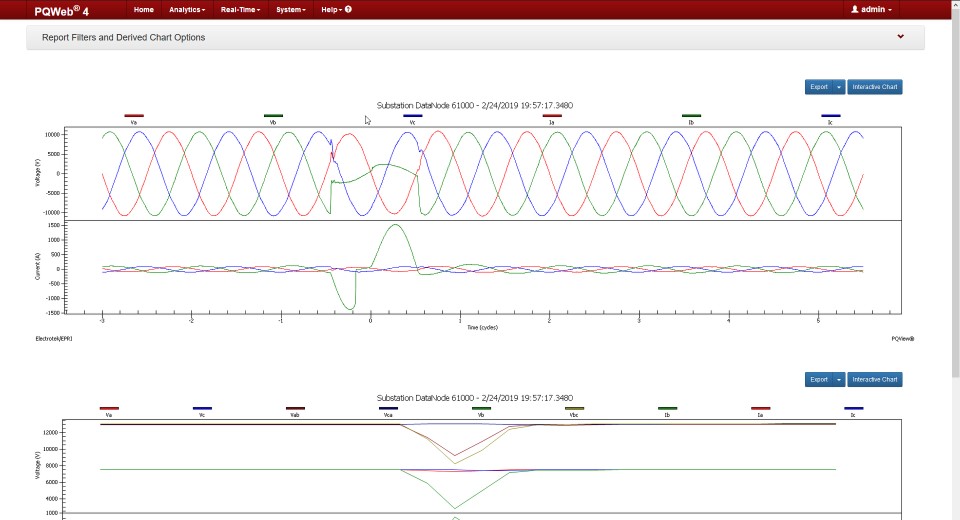
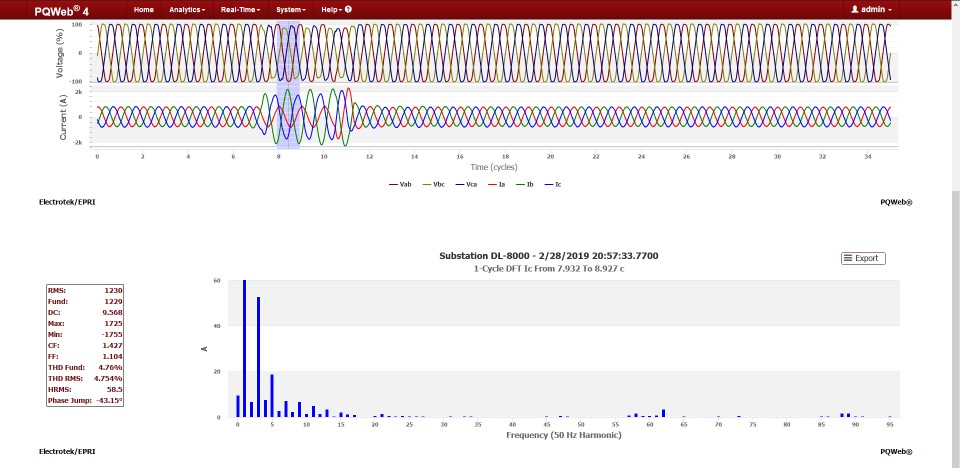
Spectrum from 1-Cycle Window

Provides 1-cycle window for analysis.

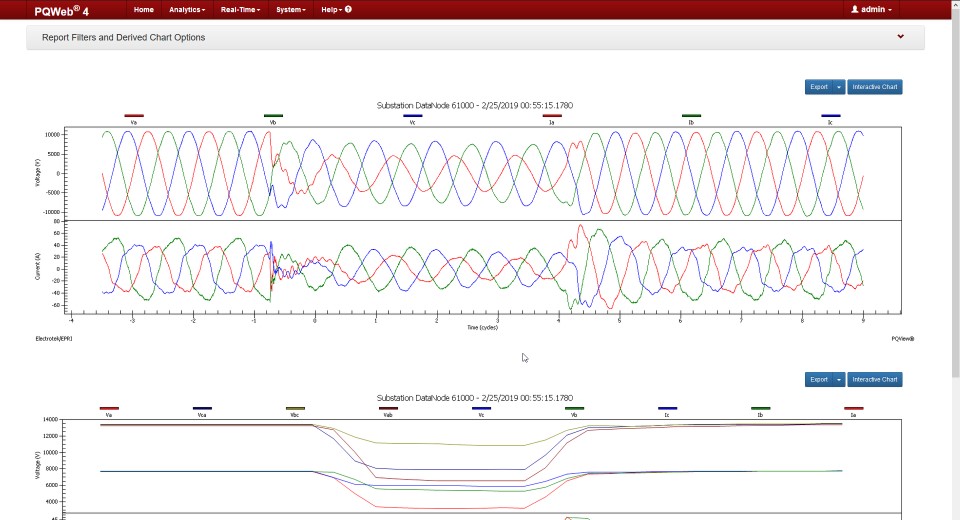
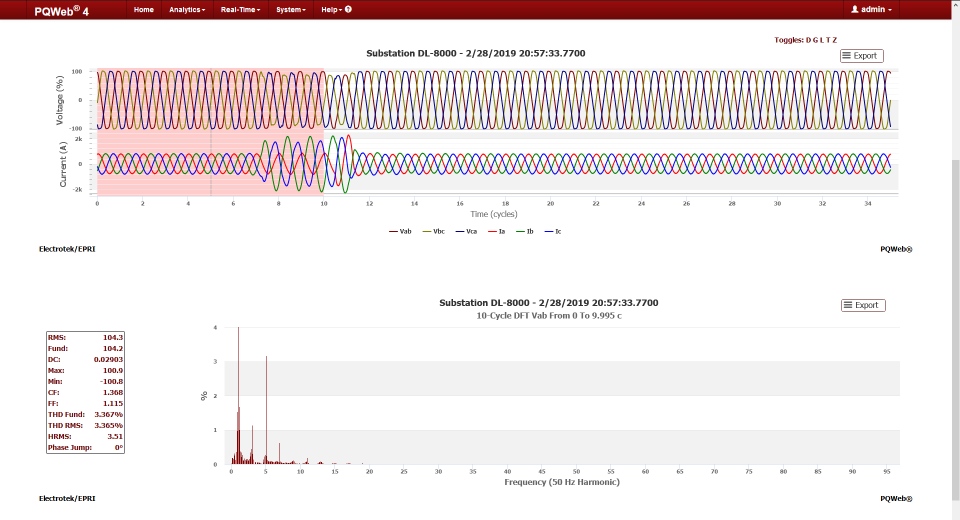
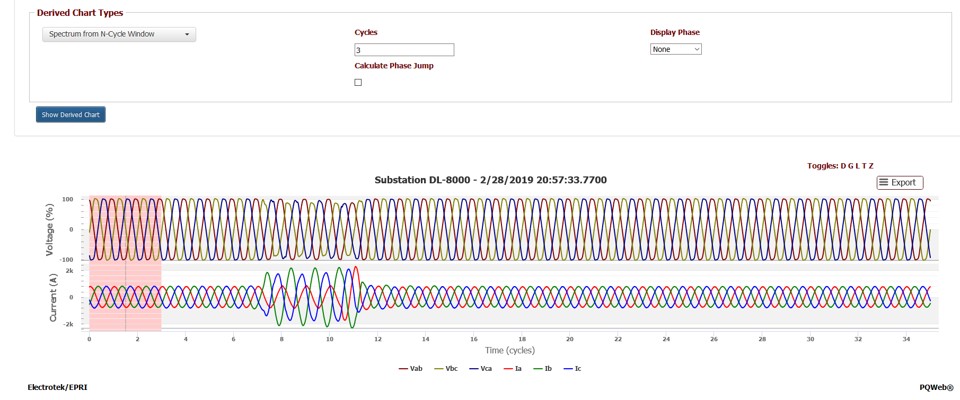
Spectrum from N-Cycle Window

You can customize N-cycles on your spectrum chart
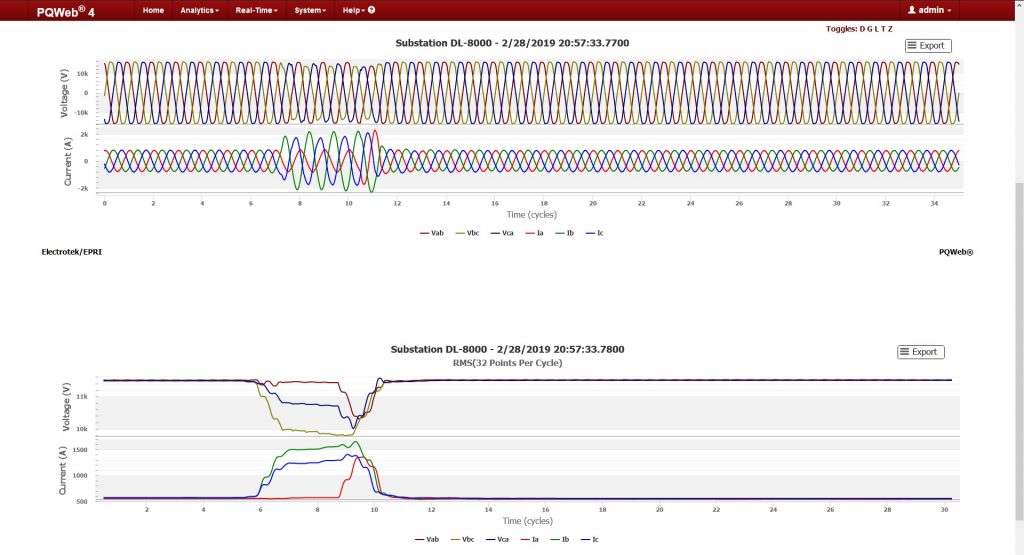
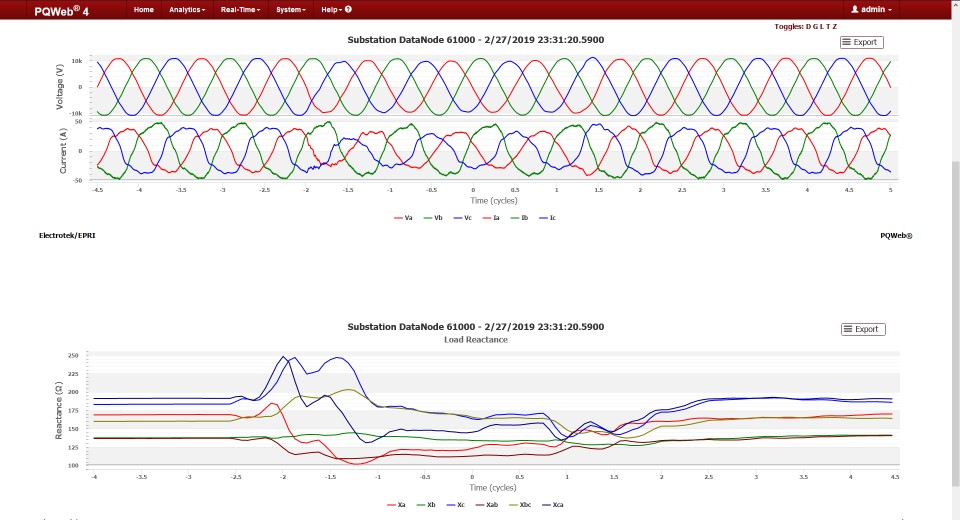
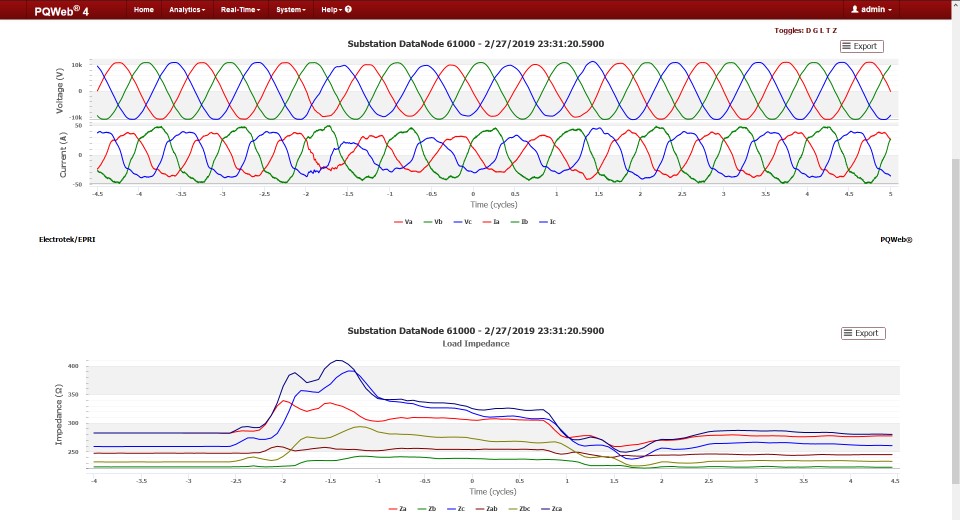
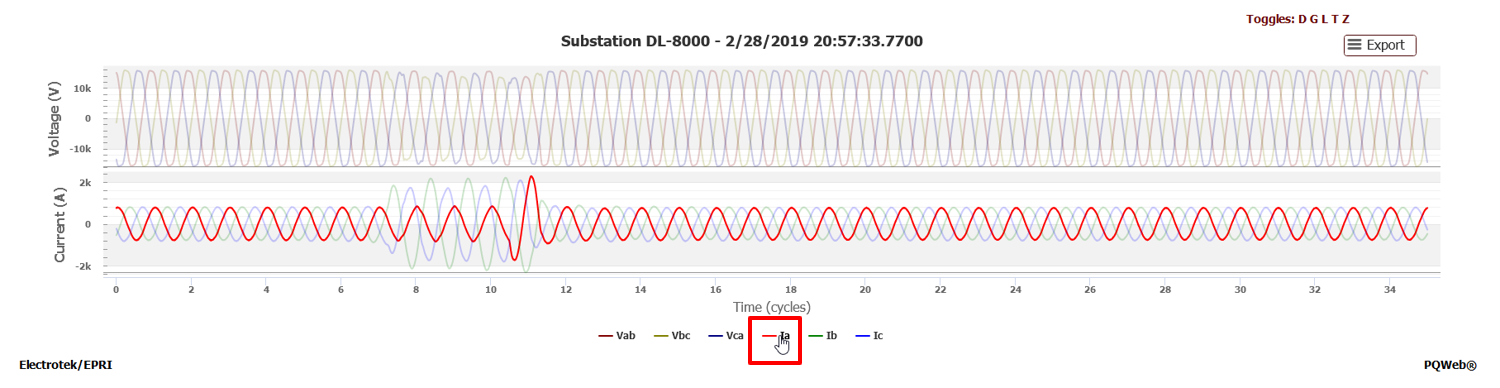
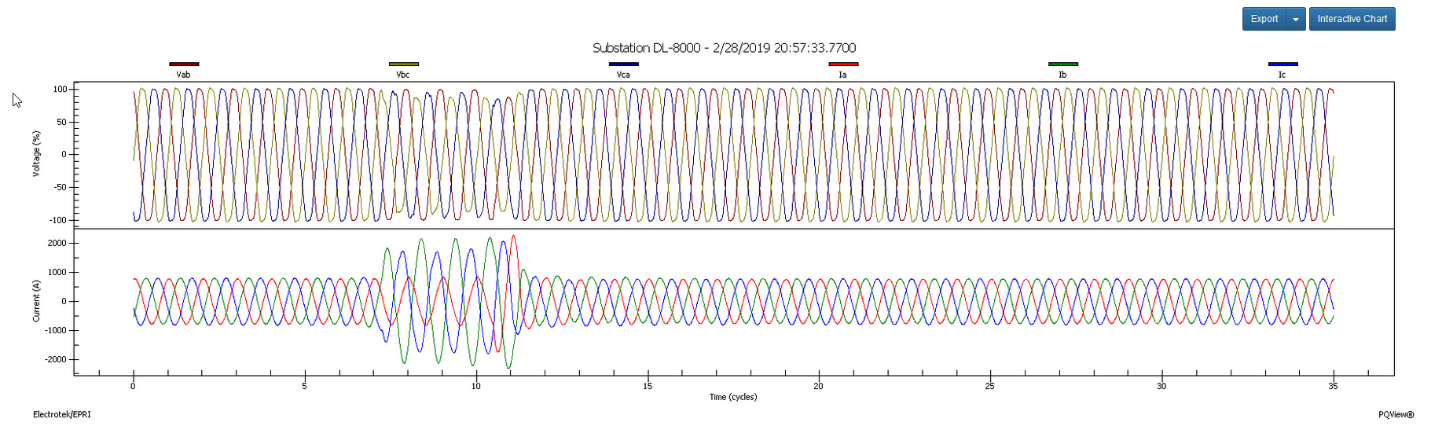
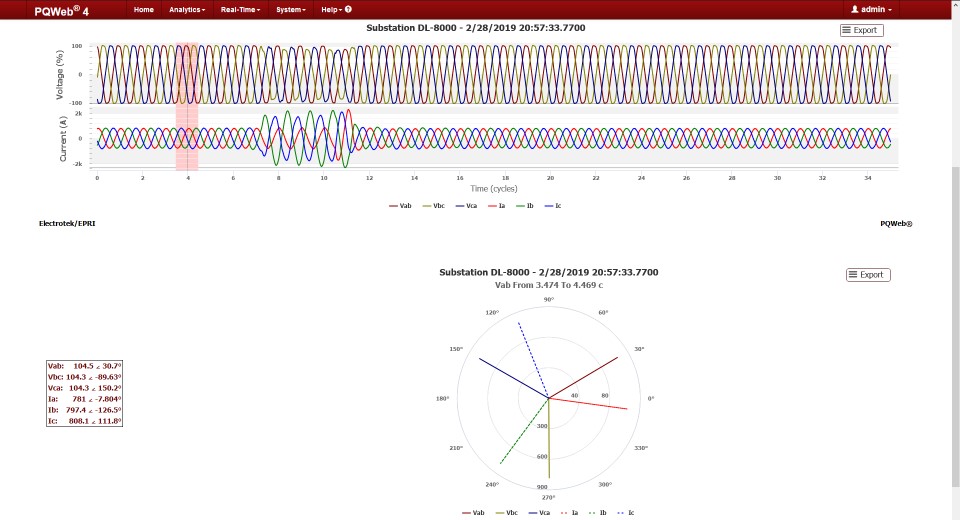
Phasors

Allows you to see both voltage and current waveforms with corresponding phasors

Spectrum and Phasors

One view for both spectrum and phasors for quicker analysis.

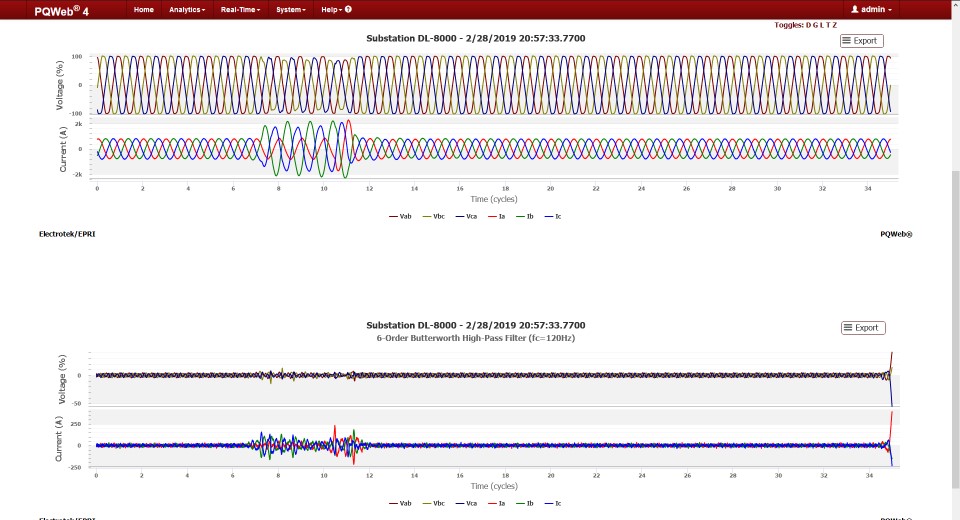
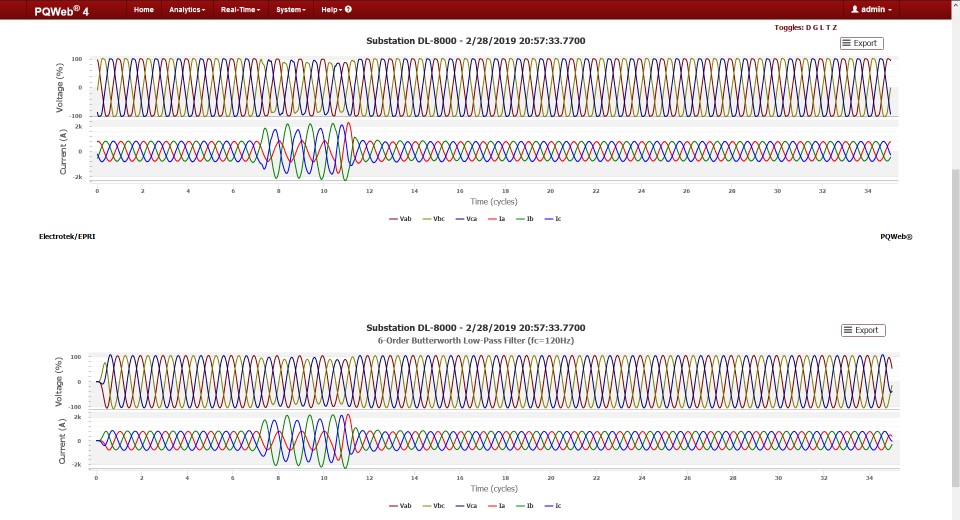
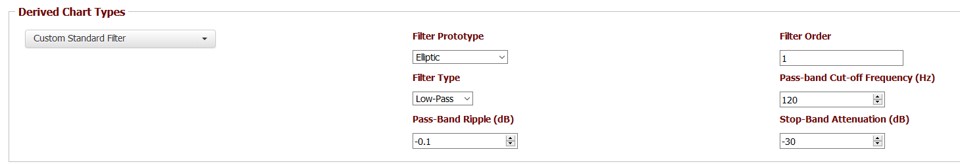
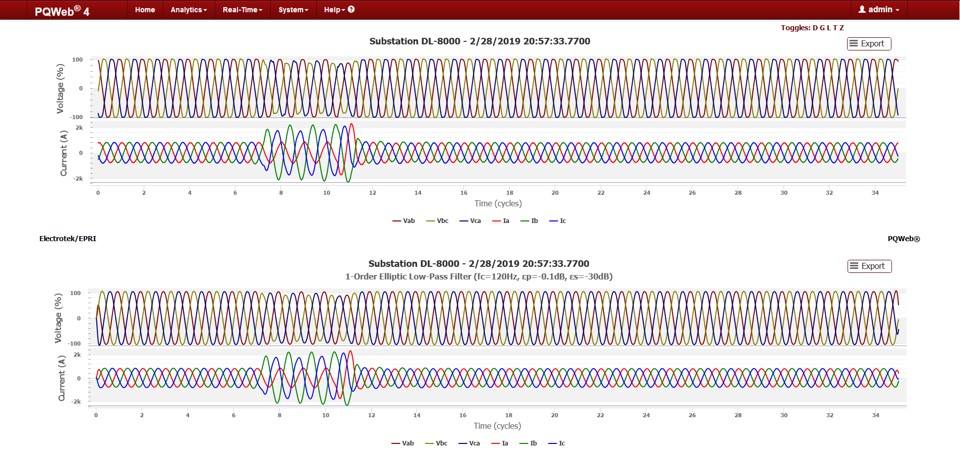
PQView 4 charts allow you to apply filters to your data, such as high pass filter, low pass filter and it provides their properties. It also gives you the ability to customize the derived charts.

High Pass Filter (HPF)

Low Pass Filter (LPF)

Custom Filter Derived Charts

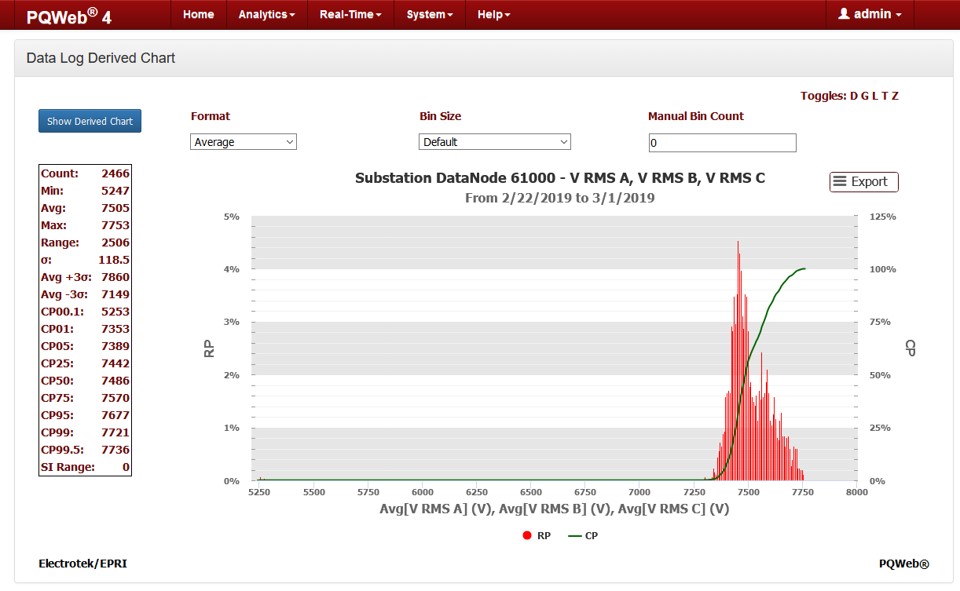
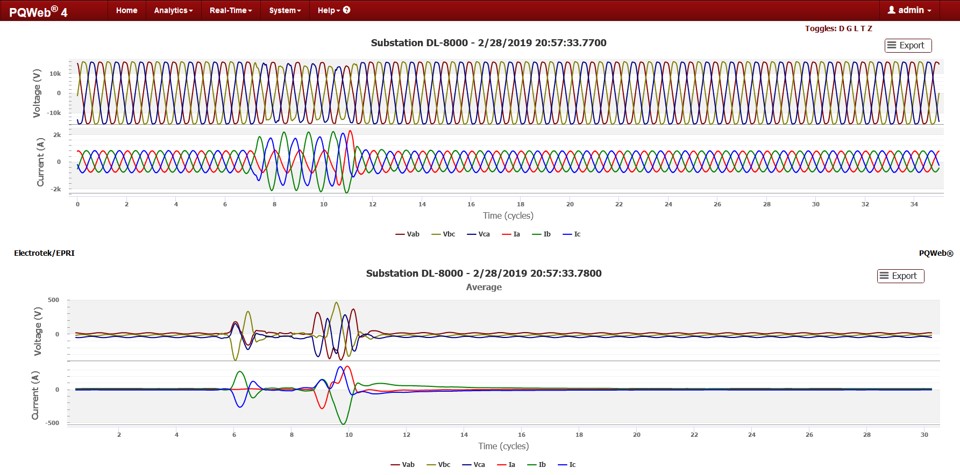
Mean Value Derived Chart

Form Factor Derived Charts

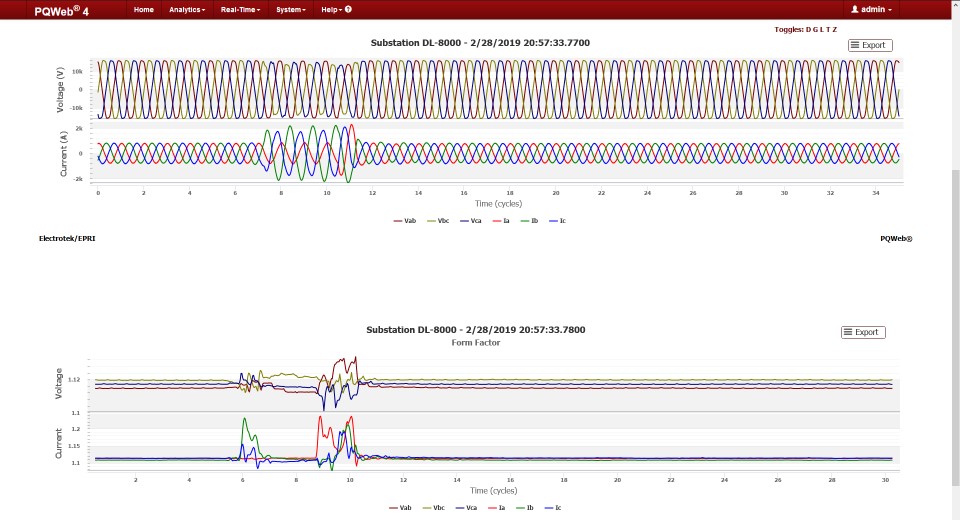
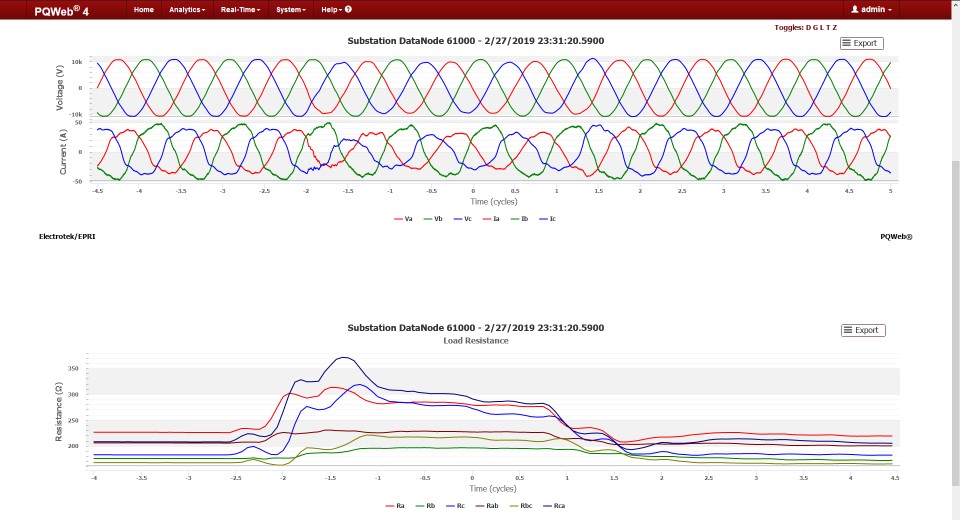
Load Resistance Derived Chart

RMS Variation Analysis

The charts below are a sampling from the scores of methods provided by PQView to analyze RMS variations. An RMS variation can be subcategorized as a voltage sag or voltage dip, voltage swell, undervoltage, overvoltage, momentary interruption, or sustained interruption.

All charts can be download it to JPEG, PDF or other known formats for your convenience.

RMS Value Derived Chart

CBME Mag-Dur Plot

ITIC Mag-Dur Plot

SEMI F47 Mag-Dur Plot

Load Reactance Derived Chart

Load Impedance Derived Chart

Real Power Derived Chart

Reactive Power Derived Chart

Apparent Power Derived Chart

Power Factor Derived Chart

Total Harmonic Distortion Derived Chart

Fault Analysis

Charts useful for analyzing and/or locating transmission and distribution system faults.

All charts can be download it to JPEG, PDF or other known formats for your convenience.

Fault Chart

Fault Viewer

Feeder Segment Details

Data Logs

Charts showing analysis of steady-state measurements, interval measurements, and snapshot measurements.

All charts can be download it to JPEG, PDF or other known formats for your convenience.

RMS Voltage Report

Data Aggregation

Provides you with the option to aggregate data with various customized parameters

Data Log Chart

Event from Data Log Chart

3-Phase Event Detail

Data Log Histogram

Profile Derived Data Log Chart

Min/Avg/Max Derived Chart

Percent Delta Derived Chart

Crosstab by Week Derived Chart

Also available per day, week, and year.